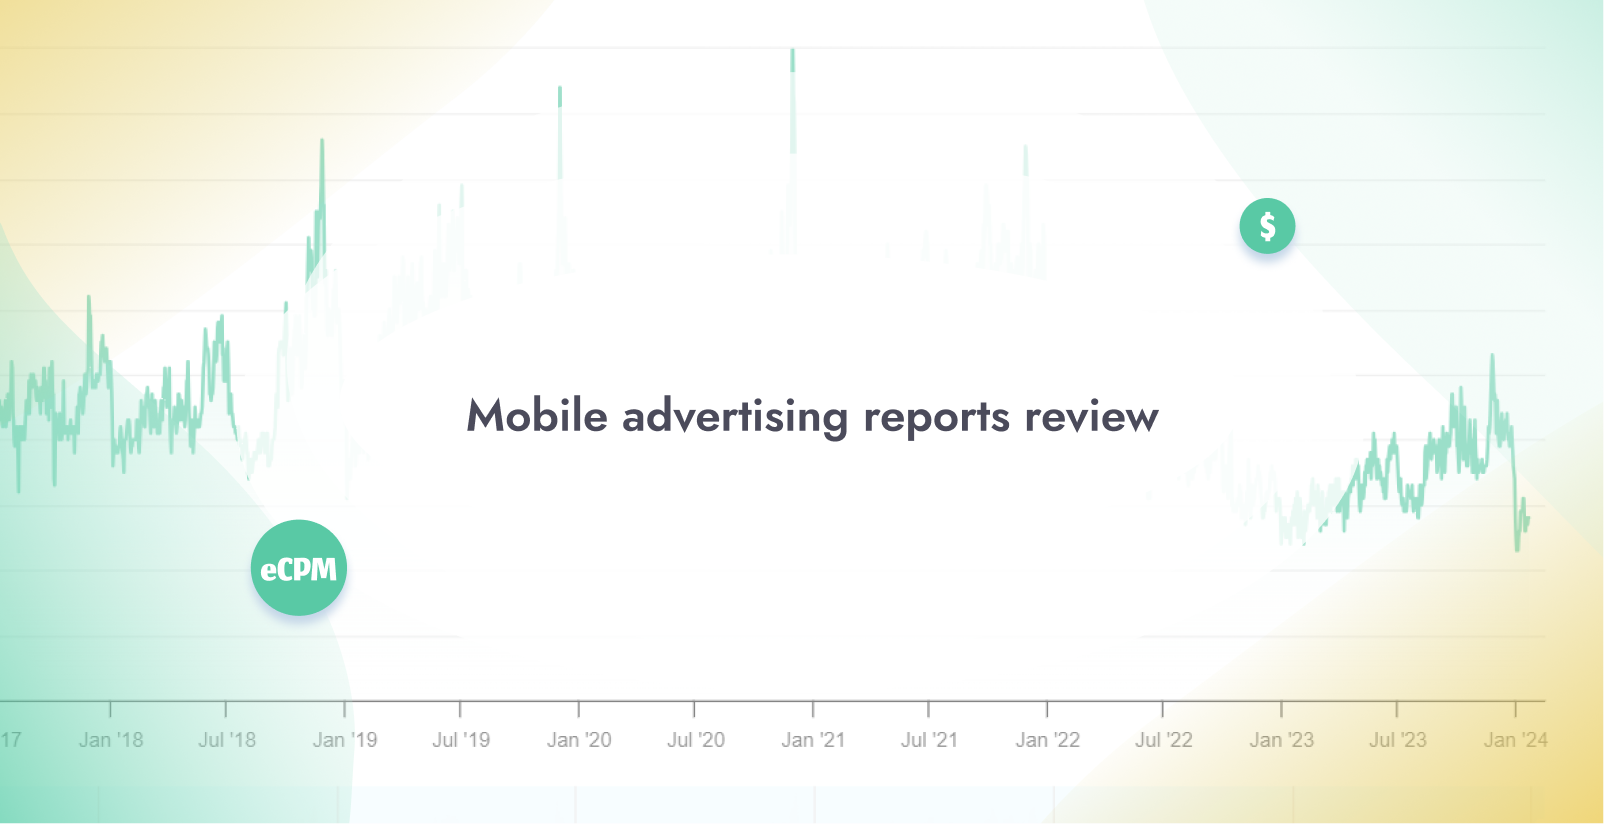
In order to effectively make decisions regarding business plans and published apps, having access to relevant data is crucial. Such data enables you to compare the performance of your product with the market average and even make predictions about its future. This is especially relevant for ad monetization results, where specific data such as average eCPM levels and individual network performance are highly valuable. Currently, the internet offers a wide range of reports and statistics that reveal the realities of the mobile gaming market. We will provide details about the type of data collected, payment requirements, and availability of the abovementioned reports and indexes.
1. optAd360’s Ad Revenue Index (free, available 24/7)
Ad Revenue Index is a tool that allows mobile app developers to see past trends in ad monetization revenue. It displays data up until a few days prior to the current date, showing the advertising earnings of publishers within the optAd360 network from more than 4000 websites and apps. The index considers ad sources that are a part of the optAd360 network, such as Google AdX and other well-known SSPs like Adform, Xandr, PubMatic, Taboola, and Criteo. The data is displayed separately for each day in the form of an easy-to-read chart. The revenue for each day is represented on the Index scale from 1 to 99, proportionate to the one with the highest result – the reference point is the day with the highest ad revenue generated, recognizable in the chart by value 100.
By using this tool, developers can compare earning trends at a particular time of the year, prepare for possible increases in user activity, and understand the natural, temporary declines in earnings at a given time. Additionally, it allows developers to compare their profits with the rest of the market. If revenue drops significantly when the market doesn’t show the same tendency, it’s worth investigating their ad inventory and monetization processes to ensure that everything is working as it should.

2. AppsFlyer performance index (free, after providing contact details)
The 16th edition of AppsFlyer’s best media sources index covers the second and third quarters of 2023 (every edition covers the time frame from April until September) and presents a ranking of 75 mobile media sources based on 11.5 billion app installs from 30,000 apps. The index is divided into 3 main categories, each category with 2 separate rankings – power ranking and volume ranking. The first one emphasizes a media source’s potential to acquire and retain top-notch users. The second one takes into account the total number of installs attributed. Importantly, the ranking authors put much effort into excluding fraudulent installations from the calculations.
The 3 categories of the AppsFlyer performance index are:
- iOS SSOT Index – by merging information from SKAN (SKAdNetwork, an Apple’s framework for attribution and ad measurement) and AppsFlyer attribution, this tool ranks the top media sources on iOS;
- Android Index – its purpose is to show the ranking of the best media sources on Android (information is derived from AppsFlyer attribution and a robust retention score);
- Remarketing Index (Android) – this one is calculated upon two factors: remarketing conversions (users who already have the app installed that interact with the remarketing campaign or reinstall the app) and revenue score from these conversions.
Thanks to the report, the developers can decide which media source, or a compilation of different media sources, may prove to be the most profitable. Importantly, the AppsFlyer website also offers other reports and indexes, for example, “The AppsFlyer Performance Index: Country Edition” – where, among other things, you can find data on markets with good and poor performance in 13 game genres and 24 non-gaming categories – for Android and iOS.

3. Moloco – Mobile App Performance Marketing Global Report (free, has to be downloaded)
Moloco has partnered with Ipsos, a leading independent market research company, to determine trends related to mobile app marketing. 1,675 marketing managers were interviewed (from 9 countries: France, Germany, Indonesia, Japan, Singapore, South Korea, Great Britain, the United States, and Vietnam) who directly supervise the application’s marketing strategy. The report may prove particularly useful for planning marketing strategies. From the report, you can learn, among other things: “Reasons for the increase in performance marketing budget: 2023 vs. 2022”, “Reasons for being satisfied with mobile app performance marketing in 2022”, “First choice KPIs that companies use for mobile app performance marketing.”
This is the first edition of the report dedicated to mobile app performance marketing, but it is expected that more reports related to the industry will appear on the website. For example, previously published reports include the “Mobile Ad Formats Performance Report” from 2020, which shows how certain advertising formats impacted vital metrics such as ROAS (Return On Ad Spend) and retention. Calculations were based on 100 ad campaigns for 32 casual gaming apps.

4. Appodeal – Mobile eCPM Report (free)
The Mobile eCPM Report is a valuable resource for developers, offering a range of insightful analyses across 3 ad formats (Rewarded Ads, Interstitial, Banner), two platforms (iOS and Android), and more than 80 ad networks. What sets this report apart is its quarterly updates, allowing developers to stay on top of the latest trends and data. Interactive charts make it easy to access information on eCPM performance across different countries and quarters, providing helpful insights into the performance of the 3 ad formats and 2 platforms. Additional value brings monthly eCPM transformations in mature and emerging countries and a short description of the most important insight on Rewarded Video ads, Full-Screen ads, and Banner ads.